Measure · 12/12
Social Media Performance Analysis
Objective
Evaluate social media content performance using key performance indicators (KPI) to measure audience engagement, identify high-performing content, and improve future content strategies.
Scope of work
- 01Analyzed content performance using Meta Business Suite insights.
- 02Monitored KPIs, including Engagement Rate (ER), Reach, Impressions, CTR, and Cost Per Click (CPC).
- 03Compared content performance to identify the best-performing posts.
- 04Evaluated audience engagement and content effectiveness.
- 05Interpreted performance data to provide recommendations for future content optimization.
- 06Prepared a performance report based on campaign results and KPI achievements.
The work
CTR
9.7%
Target > 3% for ads
CPC
Rp 222
Low CPC = efficient
Reach & Impressions
811Reach
821Impressions
Impressions > reach = repeated views, good for awareness
Engagement Rate (ER) by followers
90%
18 of ~20 followers engaged (new account, small base)
Top posts by engagement rate
- Post A90%
- Post B20%
- Post C45%
Post A (highest ER) becomes the content-format reference
Formulas
- (80 ÷ 821) × 100 = 9.7%
- 18 ÷ 20 × 100 = 90%
| KPI | Target | Achieved | Read |
|---|---|---|---|
| Engagement Rate (ER) by followers | >5% very good; 3–5% sufficient; <3% needs content/CTA optimization | ER = engagement ÷ followers × 100% = 18/20 = 0.9 × 100% = 90% | Of ~20 followers, 90% interacted with the shared content |
| Reach & Impressions | Impressions > reach means content was seen repeatedly (good for awareness); impressions < reach is suboptimal | Reach 811, Impressions 821 | Reach < Impression, so distribution is optimal for awareness content |
| Top performing content | Best content by chosen indicators | Post A ER 90%, Post B ER 20%, Post C ER 45% | Post A (highest ER) becomes the content-format reference |
| CTR | >3% good for ads; 1–2% sufficient; <1% copy/visual needs improvement | (80 ÷ 821) × 100% = 9.7% | KPI target exceeded, so content works well for ads |
| CPC | Low CPC = efficient; high CPC = needs targeting/ad optimization | Rp 222 | Low CPC, so promoted content is very efficient |
Meta Business Suite insights, Pedasaurus training project.
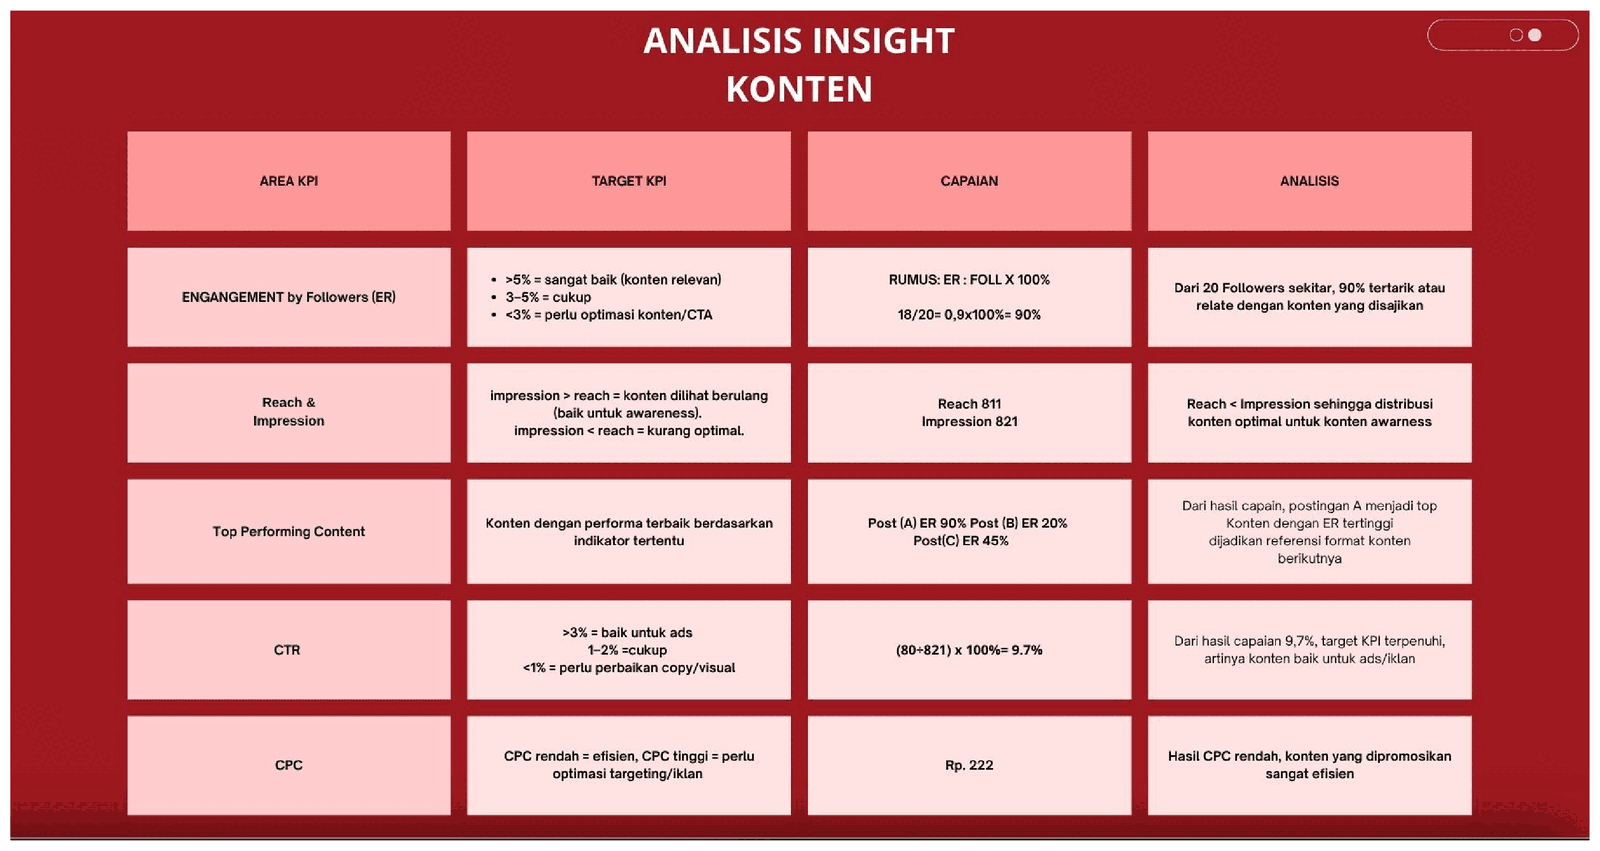
Source slide
Result
Evaluated social media performance by analyzing engagement, reach, impressions, CTR, and CPC. Identified the highest-performing content and provided insights into audience behavior and content effectiveness. Recommendations were developed to improve future content strategy, increase audience engagement, and optimize overall social media performance.